Traditionally I do not write about anything on my blog outside the realm of programming, but the 10th Anniversary of the tragedy that occurred on September 11th, 2001 is certainly worth mentioning and reflecting upon.
To most of us concerned with reading this blog, we are of an age where we probably remember exactly what we were doing and where we were 10 years ago today. At the time I was living in Charlotte, NC where I was in my last semester at U.N.C. Charlotte and preparing for a large job fair on campus. It was also exactly 1 month after my wedding which was celebrated in Puerto Rico with my wife's and my family on August 11, 2001, and also in which we also just celebrated our 10 year wedding Anniversary last month. It was a new and transitioning period in my life. At the time I was vying for my 1st job and it was right after the ".com bust" and programming jobs were few and far between. We had companies like Alltel come to campus and have 200 people show up to a brief announcement, for only 2 open positions. I was dressed to the nines and headed to Kinkos to make copies of my resume for the job fair. My wife called me and with a bit of confusion told me, "Some hotels in New York City had been blown up...", but I wasn't really sure what she was talking about. When I arrived at Kinkos I knew something even bigger was occurring when I read a sign on the door that said: "We are closing at noon due to the recent events." I went back to my apartment and turned on the TV as was everyone else. The rest is a sad part in our nations history.
I read the tributes made in our local paper today and it was shocking and eye-opening to once again see the names of all of the people that lost their lives on 9/11. It was a bit jaw dropping when looking at what was about a 5 point font used to fit all of the names in on roughly 3 pages. I remember it was about 3,000 people, but seeing it in print was a reminder of what happened on that tragic day. Of course this does not include all of the men and women of our military who have made the ultimate sacrifice since in the wars abroad.
Once such individual that continues to serve and is in Afghanistan as of this writing is my brother-in-law Captain Brain Huysman who is the Company Commander of Weapons Company: 1st Battalion, 5th Marines (http://www.i-mef.usmc.mil/external/1stmardiv/5thmarregt/1-5/subunits/subunits.jsp). On this day and every day I salute you Brian and all that serve in our military that continue to protect our nation. Thank you.
So on this 10th Anniversary, I reflect on something that changed our nation forever and I too will "Never Forget."
Sunday, September 11, 2011
Tuesday, September 6, 2011
September MSDN Webcast Training For Newbie ASP.NET Developers
If you are just getting into .NET and specifically ASP.NET, then the following (2) MSDN Webcasts would be worth attending. They are free, so search and check the site often for other topics that interest you as well. The (2) below are level 200 webcasts that are geared for new ASP.NET developers.
MSDN Webcast: ASP.NET 4.0 Soup to Nuts (Part 1): Introduction to ASP.NET (Level 200)
MSDN Webcast: ASP.NET 4.0 Soup to Nuts (Part 2): Website Basics (Level 200)
MSDN Webcast: ASP.NET 4.0 Soup to Nuts (Part 1): Introduction to ASP.NET (Level 200)
MSDN Webcast: ASP.NET 4.0 Soup to Nuts (Part 2): Website Basics (Level 200)
Wednesday, August 31, 2011
Help! My ASP.NET page is generating a JavaScript "Object Expected" Error Now That I Am Using jQuery, Plus A Little On URLs In ASP.NET
So you are all excited and just got into this jQuery thing! You build your code, run the ASP.NET site, and IT IS SO Cool...wait. You look down and see a JavaScript error in the status bar of the browser indicating the following:
"Object Expected"
Well let's begin by stating this is about a generic error message as they come and there could be 1 million different reasons for it. However if you just got into writing jQuery and are running into this error, then odds are you have not properly referenced the jQuery scripts for your application to use. I hope at least you know there are scripts that must be incuded. If you are thinking "No I didn't know", then you need to go back to jQuery 101 videos on setup.
However getting the scripts properly added to your ASP.NET application does have some nuances which make it easy to mess them up. The most common pitfall is if you have a ASP.NET site that uses a MasterPage. If this is the case, then your content pages are probably not adding the scripts individually, and the most appropriate place to register them in in the MasterPage's <Head> block.
You have (2) main options for referencing the jQuery scripts: download the scripts and include them with your project or from a CDN (Content Delivery Network) (i.e. Google or Microsoft). The upside to using a CDN is you do not have to worry about downloading the scripts into a folder and then finding that perfect path in the MasterPage to reference them. The downside is if you were working in an Intranet environment and outside access was limited or denied, then you would not be able to dynamically access those scripts.
Regardless, the 1st step in seeing if the original error described above is caused by improperly added scripts, let's go ahead and reference the jQuery scripts from Microsoft's CDN like displayed below:
Odds are your jQuery scripts are in a folder named 'Scripts', your pages in another folder named 'Pages' and maybe you have multiple levels of organizing your code files making it difficult sometimes for the proper path to be resolved. One of the BIGGEST pitfalls I see is using the Intellisense dialog when pressing the "=" sign after 'src' in a tag and navigating to the files/scripts manually. Well you would think VS.NET would give you the proper path, correct? Not always. In fact it will use a dot-dot notation (../Path/File) which seems proper, but at runtime does not resolve correctly.
In VS.NET there are going to be a few ways you can reference a path to a file and this is where things get confusing sometimes. Let's look at the (4) main ways to reference a path from the page's source:
(1.) use a relative path: using a series of backslashes "\" you can provide a path in reference or relative to your current location.
There are some good resources for explaining how to resolve path's in MasterPages and in traditional pages. Below I have included some links if you would like to investigate further or bookmark for reference.
Avoiding problems with relative and absolute URLs in ASP.NET
URLs in Master Pages
Directory path names
Microsoft Ajax Content Delivery Network
"Object Expected"
Well let's begin by stating this is about a generic error message as they come and there could be 1 million different reasons for it. However if you just got into writing jQuery and are running into this error, then odds are you have not properly referenced the jQuery scripts for your application to use. I hope at least you know there are scripts that must be incuded. If you are thinking "No I didn't know", then you need to go back to jQuery 101 videos on setup.
However getting the scripts properly added to your ASP.NET application does have some nuances which make it easy to mess them up. The most common pitfall is if you have a ASP.NET site that uses a MasterPage. If this is the case, then your content pages are probably not adding the scripts individually, and the most appropriate place to register them in in the MasterPage's <Head> block.
You have (2) main options for referencing the jQuery scripts: download the scripts and include them with your project or from a CDN (Content Delivery Network) (i.e. Google or Microsoft). The upside to using a CDN is you do not have to worry about downloading the scripts into a folder and then finding that perfect path in the MasterPage to reference them. The downside is if you were working in an Intranet environment and outside access was limited or denied, then you would not be able to dynamically access those scripts.
Regardless, the 1st step in seeing if the original error described above is caused by improperly added scripts, let's go ahead and reference the jQuery scripts from Microsoft's CDN like displayed below:
<script src="http://ajax.aspnetcdn.com/ajax/jQuery/jquery-1.5.1.js" type="text/javascript"></script>If using the script reference from the CDN above fixed the issue then great! If you want, you can leave it like that and be done. If you still want to download the scripts and have them within your project to be referenced, then we have to dig a bit deeper as to the referenced path you use for the scripts.
Odds are your jQuery scripts are in a folder named 'Scripts', your pages in another folder named 'Pages' and maybe you have multiple levels of organizing your code files making it difficult sometimes for the proper path to be resolved. One of the BIGGEST pitfalls I see is using the Intellisense dialog when pressing the "=" sign after 'src' in a tag and navigating to the files/scripts manually. Well you would think VS.NET would give you the proper path, correct? Not always. In fact it will use a dot-dot notation (../Path/File) which seems proper, but at runtime does not resolve correctly.
In VS.NET there are going to be a few ways you can reference a path to a file and this is where things get confusing sometimes. Let's look at the (4) main ways to reference a path from the page's source:
(1.) use a relative path: using a series of backslashes "\" you can provide a path in reference or relative to your current location.
<script src="/Scripts/jquery-1.4.4.js" type="text/javascript"></script>(2.) 'dot-dot' notation: this indicates, "Navigate up to the parent directory" from the path provided.
<script src="../Scripts/jquery-1.4.4.js" type="text/javascript"></script>(3.) tilde (~) character: this represents the root directory of the application in ASP.NET. The caveat is it can only be used in conjunction with server controls *not* script tags (without some server-side code help shown below). This method is not going to work well by default.
<script src="~/Scripts/jquery-1.4.4.js" type="text/javascript"></script>(4.) ResolveURL (System.Web.UI) method: This is a server-side command to convert a URL into one that is usable on the requesting client. Notice the use of the server-side code escape tags so this method can be called. This is the method I prefer and dynamically resolves the URL to the proper path. I recommend using it if you are going to reference local project script files.
<script src='<%# ResolveUrl("~/Scripts/jquery-1.4.4.min.js") %>' type="text/javascript"></script>My recommendation is to either reference the scripts from a reputable CDN like Google or Microsoft, or use Option # 3 above with the 'ResolveUrl' method. This will ensure your custom JavaScript and jQuery files are properly registered with your ASP.NET application.
There are some good resources for explaining how to resolve path's in MasterPages and in traditional pages. Below I have included some links if you would like to investigate further or bookmark for reference.
Avoiding problems with relative and absolute URLs in ASP.NET
URLs in Master Pages
Directory path names
Microsoft Ajax Content Delivery Network
Wednesday, August 24, 2011
Asynchronous Programming In .NET Is No Longer 'The Big Bad Ugly'
Let's face it, the word 'Asynchronous' still conjures up thoughts of low-level multithreading challenges and words like 'mutex' and 'deadlocked' for those of us that have been developing long before the world of .NET and even early on in the day's of .NETs inception. However, no longer should this fear or concern be so prevalent like it was in years past.
Why? Well the good folks in Redmond have added so many layers of abstractions atop of the System.Threading namespace and on Asynchronous programming techniques in general, that the developer no longer needs to know how every gear under the hood works anymore. These abstractions of Asynchronous processing have evolved in many different forms including but not limited to 'Asynchronous Delegates' (Framework 1.1), 'Background Workers' (Framework 2.0), 'Asynchronous Lambdas' (Framework 3.0 C#), 'PLINQ' (Framework 3.5), 'TPL' (Framework 3.5), and now the 'Async Framework' (CTP). All of these abstractions have a similar theme: allow the developer to quickly and efficiently create processes that execute concurrently with typically less code and a smaller chance for failure caused by improper coding that could occur when manually spawning threads attempting to achieve the same outcome. What's the result? The same one that a race car driver has when he steps into a car he didn't build himself: he doesn't need to know every detail of how the engine or car was built, but just how to drive it and finish 1st! Now it's not to say that basic or even mid-level knowledge of how these asynchronous processing abstractions (as I like to call them) are not required. In fact, if you go beyond just scratching the surface of simple asynchronous programming, the knowledge is important on how to proceed to more advanced topics and methods available. However, this still is far from the requirement of understanding everything about spawning and managing your own system threads.
One of the main draws to harnessing the potential of asynchronous processing now more than ever is the advancement in hardware that has occurred in the last 5 years. You might still have a dinosaur PC at home with a single core CPU, but odds are you have 2,4,6, or even 8 cores on your newest machine (like the 8 I have on mine, thank you Intel I7 -> read here: My New Computer: A Developers Dream) and have bandwidth to spread processing out among available cores. This basic knowledge of the number of cores or threads available in your environment where the application will be run, can help you decide on which technique to use or if the processing time will actually be reduced. However it is most likely that your environment has at least a dual-core CPU and bandwidth available to run some processing asynchronously. The end result will be you can look like a hero in a few lines of code by running long running or redundant tasks concurrently with a relatively small understanding of all of the true complexities involved in multithreading and asynchronous processing.
So for now, I will leave this discussion here and going forward will have several posts aimed to introduce or familiarize you with using some of these asynchronous programming techniques available.
Friday, July 22, 2011
Visual Studio Live! is coming back to the Microsoft Redmond Campus, October 17-21
5 days of practical and immediately-applicable training for developers, programmers, software engineers and architects in Visual Studio, Silverlight, WPF, .NET and more. And it all takes place on the Microsoft Campus in Redmond, October 17-21! Check it out at: http://tinyurl.com/3bn4by9
If you are a .NET Developer I highly recommend any of the VSLive! conferences, and where better to be then in Redmond with the gang from Microsoft.

If you are a .NET Developer I highly recommend any of the VSLive! conferences, and where better to be then in Redmond with the gang from Microsoft.
Get the MSDN Magazine for a Reduced Price
I am not sure how long this promotion will last, but check out the link below to subscribe to the MSDN magazine at a reduced 20% off price:
MSDN magazine at 20% reduced price
If you have a MSDN subscription, then you already qualify to get the magazine. Just log onto your MSDN account and fill out the required information to get the magazine as part of your paid MSDN subscription.
MSDN magazine at 20% reduced price
If you have a MSDN subscription, then you already qualify to get the magazine. Just log onto your MSDN account and fill out the required information to get the magazine as part of your paid MSDN subscription.
Wednesday, July 13, 2011
Debugging Code Techniques In VS.NET 2010
OK so you have a problem in code either during development, testing, or production and do not know exactly how it is occurring. What do you do? For those of you that are thinking your code does not have problems or there should never be problems in the 1st place, please click here. For the rest of us in the real world, you might be thinking about a new tool like 'Intellitrace' to track down exactly when the error occurred. But not everyone has that environment created and even with using it, you still need to figure out *why* it occurred. How do we do this... DEBUG the code!
So now a lot reading this might think, "Well yeah I know all about debugging, simple stuff." That may be all and true but it surprises me how many developers out there based on questions I see asked a lot from an array of environments only know (2) buttons on the keyboard when it comes to debugging: [F10] and [F11] (Step Over & Step Into with default key mapping). Oh yeah and [F5], Start!
To be good at debugging and playing detective to track down problems or anomalies that cause problems, Microsoft has provided us with a plethora of debugging options within VS.NET. Most of the techniques have been around for multiple versions of VS.NET and *some* of the techniques still not known by a faction of developers stretches all the way back to the old VB Visual Studio IDE.
So let's review the (3) most basic debugging techniques: Step Into [F11], Step Through [F10], and Step Out [Shift + F11]. Step Into [F10] will execute each line of code, going into any method, property, etc. call. This is the most granular way to trace each line of code. Step Through [F10] will *not* go into code that makes up a property, method, etc. and rather execute that code completely without executing line by line, returning control to the developer to debug the next immediate line of code after execution has completed. The last one I mentioned, 'Step Out' [F11] is one I find under used even though this is functionality that stretches back to VBA and VB6 (ever watch someone hold down the F10 key or press it like they are tapping on a snare drum to exit out of a method?). What this does is allow the developer debugging to exit out of the method immediately allowing control to be passed back to the next line of code after the calling code to the current method was made, but still completes execution of the current method, property, etc.. This works well for the following example - let's say you have a method you are debugging and it is 50 lines of code. You need to understand what is happening between lines 5-10 and the rest is not important for what you need to know. What you would do is press [F11] to step into the method to debug and gather the information needed, but once you were finished observing lines 5-10 you want to return execution back to the caller but yet finish execution of the current method. You can do this by 'Stepping Out' of the routine by pressing [Shift + F11]. A lot better than placing a break point the line after the caller and pressing [F5] or trying to press [F10] another 30x to finish the method.
This really so far is super basic stuff and hopefully a bore or quick review to any intermediate or seasoned developer. But you know as well as I that the hard to track down issues, 'anomalies' happen all too often and there are a lot of other ways to debug and track down issues. One way I discussed previously is by using conditional breakpoints which I talked about in the following post: How to: Set a conditional breakpoint in VS.NET Ever press [F5] over and over hovering over a single variable value until the last name is 'Smith' or the value is 'x'? Well setting conditions on breakpoints to only stop execution when that condition is = True is well worth reviewing.
There are also several 'helper' tools that go along with debugging to help make the debugging process more efficient. So let's begin with a few tools to help with debugging. The 1st is 'Debug Labels'. Labels on debug points are useful to define descriptions or add attributes to help with individual breakpoints to provide information about it. This will carry over and be quite useful when exporting breakpoints as I will show next. So to begin, bring up the breakpoints window. The easiest way to do this is to press [Ctrl] + [Alt] + [B] on the keyboard. The window below shows this:
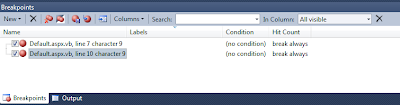
The Windows shows all active breakpoints and provides several sorting options and customizable features for breakpoints directly in the window. I will not go through them all here, so take a look and explore yourself. One very important feature to take note of in this window, is that any action you select to preform on the breakpoints will only be carried out on the actively displayed breakpoints as a result of any searches you have made. So If you have 10 total breakpoints, and preform a search that reduces the list down to 3 breakpoints, only those 3 in the search results will be acted upon. To clear any search criteria, press the 'X' to the right of the 'In Column' selection list.
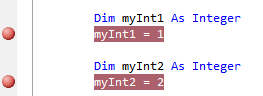
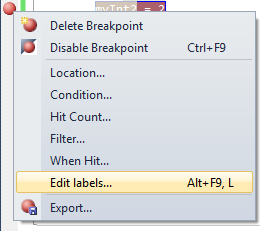
In the block of code above I have set (2) breakpoints and notice they both display down in the Breakpoint Window displayed previously. What I want to do is create a label and assign it to this breakpoint. There are (2) ways to do this: either right click the breakpoint in the code editor or in the Breakpoint Window to bring up its options Window and select 'Edit Labels...'
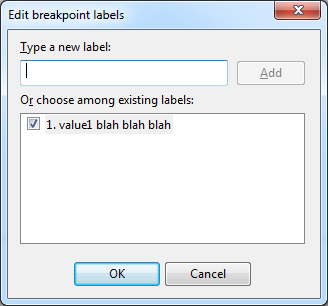
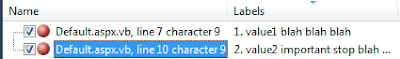
To add a label, type in a description or attribute, and press 'Add' as shown below. There is a 64 character limit, and you can not have commas. You can add as many label descriptions through the window at a given time, and assign as many labels as you want signified by the checkbox(s) selected to the left of the requested label(s). These labels will be available for assignment to other breakpoints as well:
Once a label is created it can be assigned to 1..n breakpoints. Maybe you have a set of breakpoints that are similar and all need the same label. Another possibility is you have some sort of numeric order description. In this case the sorting ability in the Breakpoint Window is nice. Just sort the column to get the label description in order. This can help with a set of imported breakpoints or for walking through your own defined breakpoints. From this window you can search through the breakpoint labels as well. Just change the 'In Column' value to 'Labels', and type in the search criteria. The list will filter down based on the search results.
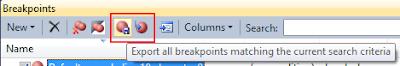
The next feature available from the Breakpoints Windows is the ability to Import and Export the breakpoints. Have you ever had that app you get out of source control and think "Ok I need to place (x) # of key breakpoints here, here, and here to do some task." Well what you should be doing is exporting your breakpoints and saving that file in source control. This is also really useful to pass along to other developers that might be working on your project. How nice for them to have descriptive (labels) pre-defined breakpoints already defined for debugging. The task is trivial: just press the save disk icon from the Breakpoints Window and the debug breakpoints will be exported to an .xml file. The import is just as simple. Just press the Import icon and select the .xml file where the breakpoints are defined. Don't forget to add these files to Source Control.
So now a lot reading this might think, "Well yeah I know all about debugging, simple stuff." That may be all and true but it surprises me how many developers out there based on questions I see asked a lot from an array of environments only know (2) buttons on the keyboard when it comes to debugging: [F10] and [F11] (Step Over & Step Into with default key mapping). Oh yeah and [F5], Start!
To be good at debugging and playing detective to track down problems or anomalies that cause problems, Microsoft has provided us with a plethora of debugging options within VS.NET. Most of the techniques have been around for multiple versions of VS.NET and *some* of the techniques still not known by a faction of developers stretches all the way back to the old VB Visual Studio IDE.
So let's review the (3) most basic debugging techniques: Step Into [F11], Step Through [F10], and Step Out [Shift + F11]. Step Into [F10] will execute each line of code, going into any method, property, etc. call. This is the most granular way to trace each line of code. Step Through [F10] will *not* go into code that makes up a property, method, etc. and rather execute that code completely without executing line by line, returning control to the developer to debug the next immediate line of code after execution has completed. The last one I mentioned, 'Step Out' [F11] is one I find under used even though this is functionality that stretches back to VBA and VB6 (ever watch someone hold down the F10 key or press it like they are tapping on a snare drum to exit out of a method?). What this does is allow the developer debugging to exit out of the method immediately allowing control to be passed back to the next line of code after the calling code to the current method was made, but still completes execution of the current method, property, etc.. This works well for the following example - let's say you have a method you are debugging and it is 50 lines of code. You need to understand what is happening between lines 5-10 and the rest is not important for what you need to know. What you would do is press [F11] to step into the method to debug and gather the information needed, but once you were finished observing lines 5-10 you want to return execution back to the caller but yet finish execution of the current method. You can do this by 'Stepping Out' of the routine by pressing [Shift + F11]. A lot better than placing a break point the line after the caller and pressing [F5] or trying to press [F10] another 30x to finish the method.
This really so far is super basic stuff and hopefully a bore or quick review to any intermediate or seasoned developer. But you know as well as I that the hard to track down issues, 'anomalies' happen all too often and there are a lot of other ways to debug and track down issues. One way I discussed previously is by using conditional breakpoints which I talked about in the following post: How to: Set a conditional breakpoint in VS.NET Ever press [F5] over and over hovering over a single variable value until the last name is 'Smith' or the value is 'x'? Well setting conditions on breakpoints to only stop execution when that condition is = True is well worth reviewing.
There are also several 'helper' tools that go along with debugging to help make the debugging process more efficient. So let's begin with a few tools to help with debugging. The 1st is 'Debug Labels'. Labels on debug points are useful to define descriptions or add attributes to help with individual breakpoints to provide information about it. This will carry over and be quite useful when exporting breakpoints as I will show next. So to begin, bring up the breakpoints window. The easiest way to do this is to press [Ctrl] + [Alt] + [B] on the keyboard. The window below shows this:

The Windows shows all active breakpoints and provides several sorting options and customizable features for breakpoints directly in the window. I will not go through them all here, so take a look and explore yourself. One very important feature to take note of in this window, is that any action you select to preform on the breakpoints will only be carried out on the actively displayed breakpoints as a result of any searches you have made. So If you have 10 total breakpoints, and preform a search that reduces the list down to 3 breakpoints, only those 3 in the search results will be acted upon. To clear any search criteria, press the 'X' to the right of the 'In Column' selection list.

In the block of code above I have set (2) breakpoints and notice they both display down in the Breakpoint Window displayed previously. What I want to do is create a label and assign it to this breakpoint. There are (2) ways to do this: either right click the breakpoint in the code editor or in the Breakpoint Window to bring up its options Window and select 'Edit Labels...'

To add a label, type in a description or attribute, and press 'Add' as shown below. There is a 64 character limit, and you can not have commas. You can add as many label descriptions through the window at a given time, and assign as many labels as you want signified by the checkbox(s) selected to the left of the requested label(s). These labels will be available for assignment to other breakpoints as well:

Once a label is created it can be assigned to 1..n breakpoints. Maybe you have a set of breakpoints that are similar and all need the same label. Another possibility is you have some sort of numeric order description. In this case the sorting ability in the Breakpoint Window is nice. Just sort the column to get the label description in order. This can help with a set of imported breakpoints or for walking through your own defined breakpoints. From this window you can search through the breakpoint labels as well. Just change the 'In Column' value to 'Labels', and type in the search criteria. The list will filter down based on the search results.

The next feature available from the Breakpoints Windows is the ability to Import and Export the breakpoints. Have you ever had that app you get out of source control and think "Ok I need to place (x) # of key breakpoints here, here, and here to do some task." Well what you should be doing is exporting your breakpoints and saving that file in source control. This is also really useful to pass along to other developers that might be working on your project. How nice for them to have descriptive (labels) pre-defined breakpoints already defined for debugging. The task is trivial: just press the save disk icon from the Breakpoints Window and the debug breakpoints will be exported to an .xml file. The import is just as simple. Just press the Import icon and select the .xml file where the breakpoints are defined. Don't forget to add these files to Source Control.

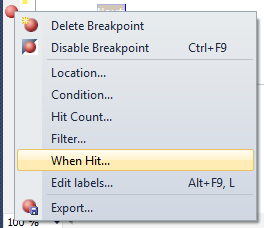
The next debugging technique helps with monitoring specific values but not having to stop execution to do so. They are called 'Tracepoints'. Have you ever been in a situation where you need to monitor a value of a variable and began writing 'Debug.Writeline' statements? Errrrr, No. Just use a tracepoint and monitor the same Output Window. This way you don't have to clutter up your code with debugging lines that later you might clear out or have to wrap in conditional #Debug statements. To create a tracepoint right-click on the actual breakpoint in the code editor or from the Breakpoints Window and select 'When Hit...'.
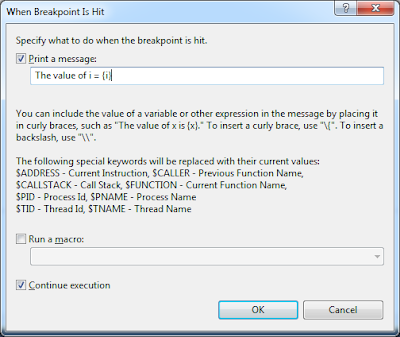
This will bring up a dialogue that allows you to type in some expressions to output needed information.
For example look at the following basic loop below.
The value of i = {i}
In my case I will leave the option checked to 'Continue execution', so I can view the output, but not have to stop execution. Notice after adding the expression your traditional breakpoint is now a tracepoint which is displayed as a diamond.
Before executing the code, make sure to have the 'Command Window' present. If it is not, you can access it by pressing [Ctrl] + [Alt] + [O]. Now execute the code that will run through the configured Trace Point. Notice execution will not halt, but the expression you provided will be output to the Command Window. Notice for the simple loop, it output all of the values.
Pretty nice and all done through a tracepoint. No need for custom logging, Writeline statements, etc. This is an especially good technique for watching values during their lifetime throughout an application and helps solve the old "I swear I clear that value out...", or "Why does that variable loose value here but have value over there...', and many, many more examples.
The last (but by far not the last available technique) topic I am going to cover are 'Pinned Data Tips' while debugging. Ever hover over a value and have to remember it for later in execution, or jot down some notes about a particular debugged line of code? Well this feature is for you then. Begin by placing a traditional breakpoint on a line, and being execution of code until the breakpoint is hit. When you hover over the variable you will get it's current value. Ever notice there is a push pin on the end of the value? Yeah, go ahead and press it as displayed below.
To move the data tip around, just click and hold the pin to drag it off to the side if needed where there is more white space. You can also add comments to that data tip. Just press the down arrows, to get a text box for typing brief comments.
 Notice as execution continues, or when you being a new debugging session the pinned data tip is still present! How cool, no more stickys on the screen or desk with random notes, values, etc. Notice how you will see it displayed as a blue horizontal push-pin in the pane where breakpoints are assigned in the editor. If it is on the same line as a breakpoint it will be mostly hidden.
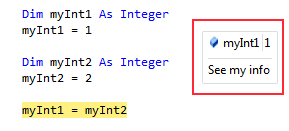
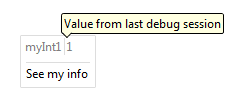
As mentioned, once you being debugging again (even after stopping execution), you defined push-pins will reappear but there is one more useful added feature. Notice how the push-pin will display the last debugging session's value. This can be really useful to see how the code reacts to different input possibly, and doesn't require you to keep track of what the value was from the last time code ran through this breakpoint. The last value is displayed below:
 Note: to clear any data tips, right-click the push-pin in the code editor and select 'Clear'.

This will bring up a dialogue that allows you to type in some expressions to output needed information.

For example look at the following basic loop below.
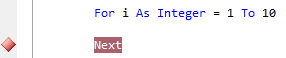
For i As Integer = 1 To 10I want to place a tracepoint on the variable to see it's output in the loop. The expression I will use is as follows:
Next
The value of i = {i}
In my case I will leave the option checked to 'Continue execution', so I can view the output, but not have to stop execution. Notice after adding the expression your traditional breakpoint is now a tracepoint which is displayed as a diamond.

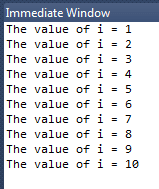
Before executing the code, make sure to have the 'Command Window' present. If it is not, you can access it by pressing [Ctrl] + [Alt] + [O]. Now execute the code that will run through the configured Trace Point. Notice execution will not halt, but the expression you provided will be output to the Command Window. Notice for the simple loop, it output all of the values.

Pretty nice and all done through a tracepoint. No need for custom logging, Writeline statements, etc. This is an especially good technique for watching values during their lifetime throughout an application and helps solve the old "I swear I clear that value out...", or "Why does that variable loose value here but have value over there...', and many, many more examples.
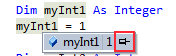
The last (but by far not the last available technique) topic I am going to cover are 'Pinned Data Tips' while debugging. Ever hover over a value and have to remember it for later in execution, or jot down some notes about a particular debugged line of code? Well this feature is for you then. Begin by placing a traditional breakpoint on a line, and being execution of code until the breakpoint is hit. When you hover over the variable you will get it's current value. Ever notice there is a push pin on the end of the value? Yeah, go ahead and press it as displayed below.

To move the data tip around, just click and hold the pin to drag it off to the side if needed where there is more white space. You can also add comments to that data tip. Just press the down arrows, to get a text box for typing brief comments.
 Notice as execution continues, or when you being a new debugging session the pinned data tip is still present! How cool, no more stickys on the screen or desk with random notes, values, etc. Notice how you will see it displayed as a blue horizontal push-pin in the pane where breakpoints are assigned in the editor. If it is on the same line as a breakpoint it will be mostly hidden.
As mentioned, once you being debugging again (even after stopping execution), you defined push-pins will reappear but there is one more useful added feature. Notice how the push-pin will display the last debugging session's value. This can be really useful to see how the code reacts to different input possibly, and doesn't require you to keep track of what the value was from the last time code ran through this breakpoint. The last value is displayed below:
 Note: to clear any data tips, right-click the push-pin in the code editor and select 'Clear'.
These debugging techniques are just a small sampling of all of the available features. Feel free to add comments for any other features you find useful as well. The main point to drive home is that to be successful in software development will at one time or another require 'playing detective' and tracking down unknown issues, anomalies, or maybe just learning how code behaves line by line. To do these tasks well you have to be efficient at debugging. So if you are one of the few that admits they only knew about (2) or (3) Function keys used for debugging, try some of these and many other documented debugging techniques to help you expand your problem solving abilities in VS.NET.
Subscribe to:
Posts (Atom)