Tuesday, March 31, 2026

AI Slop, Human in the Loop, and When Languages Still Matter

I've said multiple times, AI is the biggest evolution in software engineering and technology I've seen in my career of 25 years. The capabilities we are seeing in code assistant tools backed by powerful LLMs have gone from simple auto-complete and chats just a couple of years ago, to today being sophisticated implementation capabilities via local or asynchronous cloud agents doing many tasks in parallel to solve problems.

That is not hype, and it is not theoretical. It is happening right now.

I have had a lot of conversations lately with smart people across our industry, and one theme keeps coming up over and over: even the people closest to this space are a bit flabbergasted by how rapidly and exponentially AI is transforming software engineering. We are watching the ground shift under our feet in near real time. What makes this moment feel different is not just that AI can help, but how fast the tools have evolved. We have gone from, "that completion was handy," to systems implementing real features, generating scaffolding, wiring up infrastructure, writing tests, and solving problems across multiple files and concerns. That is a massive jump in a very short amount of time.

It really is incredible what these tools are doing.

We are hearing more and more statements along the lines of, "I'm not even hand-rolling code anymore," or, "I haven't written a line of code in X amount of time." A couple of years ago that would have sounded absurd. Today it sounds more commonplace. That alone tells you how much has changed.

At the same time, for all the excitement, I keep coming back to the same tension. There is a huge difference between accelerated software development and uncritical acceptance of whatever the machine spits out. That is where the phrase 'AI Slop' starts to matter.

The Rise of "Good Enough"

One of the big philosophical questions right now is whether we are heading toward a world where programming languages matter less and less. Are we going to get to a point where languages do not matter? Do we care what the output is? That is a great question, because part of me understands why people ask it. If the output is good enough, it works, you write tests, you ship it, and the result is correct, is that enough?

In some cases, maybe it is.

I think that is where software may start to fall into different buckets. For some kinds of applications, especially non mission-critical internal enterprise apps, "good enough" may actually be good enough. Maybe it is an HR workflow tool. Maybe it is some internal productivity application. Maybe it is a lightweight dashboard, admin tool, or prototype that helps a business move faster. In those situations, teams may be more willing to accept AI-generated output that is not elegant, not especially idiomatic, and not something a senior engineer would be proud to hand-craft line by line.

If it works, passes tests, and solves the problem, a lot of organizations are going to say, ship it. There are parts of me beginning to see this side of the equation.

But there is another category of software where that mindset breaks down very quickly. You might accept that approach for some internal line-of-business application, but would you fly on a plane with code created that way? Would you use a medical device created that way? That is where this discussion gets serious fast.

Human in the Loop Is Not Optional

The phrase "human in the loop" gets used a lot, and sometimes it can sound like a comforting slogan. I think it is a lot more than that. It is the thing standing between powerful acceleration and dangerous overconfidence. Because the problem is not just messy variable names, awkward abstractions, or code that feels a little off. The deeper problem is that these systems can fabricate details with total confidence.

That is the part people underestimate.

I was reflecting on an example recently where "good enough" was peeled back and examined under the covers. It was not about style nits or whether the AI chose the perfect algorithm. It was about the model inventing things that mattered, such as security-related details and keys. And when challenged, it effectively admitted, "To be quite frank, I just made it up."

That is funny for about two seconds.

Then it becomes a sobering reminder that an LLM is not a truth machine. It is not reasoning in the way many people emotionally want to believe it is. It is an incredibly powerful prediction engine that can produce brilliant results and absolute nonsense, sometimes in the same output. That is why human review is not some temporary training-wheel phase we can casually discard. It is part of the engineering discipline.

Human in the loop means architecture review still matters. Code review still matters. Threat modeling still matters. Testing still matters. Domain expertise still matters. Knowing what looks right versus what is actually right still matters.

This is where being able to "call a spade a spade" is immensely important when using AI to generate code. This is also why we as experienced engineers are highly valuable in this AI age. We can do this.

It also means accountability still lands on us. The AI does not carry the pager. The AI does not sit in the postmortem. The AI does not own the security breach, regulatory failure, lawsuit, or customer impact. We do.

So, Do Languages Still Matter?

I think the honest answer is yes, even if the way they matter begins to shift.

If AI keeps getting better at generating working code, then many developers may spend less time manually authoring syntax line by line. That part is probably true. The abstraction layer is rising. In some workflows, we may express intent more than implementation. But that does not mean languages stop mattering.

Languages still shape ecosystems, performance characteristics, deployment models, memory behavior, concurrency patterns, tooling, maintainability, interoperability, and the kinds of mistakes that are easy or hard to make. Languages still influence how systems age over time. They still matter when debugging. They still matter when optimizing. They still matter when the generated output is subtly wrong and somebody has to understand why.

Even if AI becomes the primary producer of code in many cases, humans still need to evaluate the tradeoffs. You may not type every line, but you still need to understand the consequences of what was produced. That is especially true for consultants, architects, and senior engineers. Our value increasingly shifts from, "I can manually write more code than the next person," to, "I can guide systems, evaluate output, recognize risk, and make sound decisions with accelerated tooling."

That is a meaningful shift, and I do not think it diminishes engineering. If anything, I think it raises the bar.

Nobody Has a Crystal Ball

The bottom line is simple: nobody has a crystal ball. Nobody knows exactly what tomorrow holds. We can say 'AI' the same way the industry once said 'cloud' or 'DevOps', but that does not mean we fully understand where it is taking us. We know it is transformative. We know it is already changing how software gets built. We know it can unlock incredible productivity. We also know that parts of the industry are getting ahead of themselves and treating confidence as correctness.

Both things are true at once.

That is why I think the healthiest posture right now is neither cynicism nor blind enthusiasm. It is really more of an optimism tempered by discernment. We should be using these tools, learning them deeply, and pushing them hard, because they can genuinely take a lot of repetitive work off our plate, increase throughput, and help us think bigger and move faster.

But do not confuse fast with sound.

Do not confuse output with understanding.

And definitely do not confuse "it runs" with "it is trustworthy."

AI is changing software engineering faster than anything I’ve seen in 25 years. I’m excited about it, and I’m using it heavily. But I’m also convinced that the more we lean on AI to generate software, the more human judgment, review, and technical depth matter.

Languages, architecture, and accountability still matter, maybe now more than ever.

The tools are incredible, but the responsibility is still ours.

Tuesday, June 17, 2025

I'm Speaking! TrailBlazor Conference 2025

On June 26th, 2025, Devessence Inc., in partnership with Syncfusion, will host the TrailBlazor Conference, a free one-day virtual event showcasing the spirit of excitement and innovation within the .NET developer ecosystem featuring Blazor, .NET MAUI, .NET Aspire, and Oqtane. 

We have lined up some amazing speakers for the event, including members of the Blazor, .NET MAUI & .NET Aspire product teams from Microsoft, as well as many other respected leaders and peers of mine within the .NET community. 

I'll be doing the session, "Zero to Blazor Apps with GitHub Copilot," at 1PM ET (5PM UTC) which showcases using GitHub Copilot to accelerate and enhance developing Blazor applications. Registration is open at https://trailblazor.net - sign up today!


Wednesday, January 29, 2025

Check Out My YouTube Channel! 'The Eclectic Dev'

As technology has evolved over the years, so has the way we have to share information with the global engineering community. To that end I created another way to reach out and share software engineering and technology information through, 'The Eclectic Dev' my YouTube channel.
Come along with me and learn about the endless world of software engineering! I'll explore a wide variety of topics. Specializing primarily in web, .NET, and cloud related technologies, I'll journey these areas and beyond to many eclectic topics of interest to share knowledge with the wider global technology community.
Check it out by clicking on the channel logo below, and please subscribe to stay tuned for a host of eclectic topics and as an extension of this blog which began over 17 years ago!


Wednesday, November 6, 2024

How to Nest Blazor's .razor Files in Visual Studio Code

When working with Blazor in Visual Studio Code, you may encounter some nuanced differences from working in Visual Studio, and would like greater feature parity. One such feature is the default file nesting as shown below from Visual Studio when it comes to Razor component files:

Visual Studio Code has the capability to nest files, but by default Blazor's files are not nested and appear in parallel. 

To update/fix this, we can update the 'File Nesting Patterns' in the Command Palette.

Open the Command Palette in Visual Studio Code by pressing Ctrl+Shift+P (PC) and then add the following search string for direct access: 

@id:explorer.fileNesting.patterns

Select 'Add Item' with the key: 

*.razor
and use the following Value:

${capture}.razor.cs, ${capture}.razor.css, ${capture}.razor.scss, ${capture}.razor.less, ${capture}.razor.js, ${capture}.razor.ts

You can add any applicable file extensions to the list above as needed. At this point you can close the settings and see the Blazor files nested correctly:

Thursday, May 23, 2024

How to Enable 'Hey Code!' Voice Interactivity for GitHub Copilot Chat

With all the smart devices around the house that can be queued with the likes of 'Hey Google!' wouldn't it be great if we could queue up GitHub Copilot in the same manner either for ease of use or required for accessibility needs? Thankfully this isn't too difficult to configure in Visual Studio Code. Once configured you can say, 'Hey Code!' and use a voice prompt to interact with GitHub Copilot chat.

GitHub Copilot Chat 'Hey Code!' Configuration Steps

  1. Open the Command Palette via Ctrl+Shift+P or F1
  2. Type in 'accessibility' to access configuration options and select, 'Preferences: Open Accessibility Settings'
  3. Add 'voice' to the configuration filter and select 'Accessibility > Voice: Keyword Activation'
  4. Select an option for where Copilot Chat interacts with you after saying aloud, 'Hey Code!' in the IDE:
    • chatInView: start a voice chat session in the chat view (i.e. the Copilot Chat main window)
    • quickChat: start a voice chat session in the quick chat (i.e. Command Palette input)
    • inlineChat: start a voice chat session in the active editor if possible (i.e. inline Copilot Chat dialog)
    • chatInContext: start a voice chat session in the active editor or view depending on keyboard focus (i.e. if the current cursor is focused within code in a file, the inline Copilot Chat dialog is used, and if the active cursor is in the Copilot Chat main window this will be used to capture the dialog)
My preference is to use chatInContext as it will toggle inline vs window chat based on current focus, but play around with the options to see which is best for you.

A quick way to access these settings once configured is to press the microphone icon in the bottom task bar of Visual Studio Code which will immediately pull up these same settings to modify directly.


Now try it out and say, "Hey Code! Help me create a new Blazor web application!"

Tuesday, February 6, 2024

How to Fix the GitHub Copilot Chat Error: 'Cannot read properties of undefined (reading 'split')'

If you're using GitHub Copilot Chat within Visual Studio code, you may begin to see an error unexpectedly after an IDE update that reads as follows when using Copilot Chat:
Cannot read properties of undefined (reading 'split')

This is caused by the Copilot Chat extension requiring a reload which can be seen from the extensions menu:

Once selecting, 'Reload Required,' Visual Studio Code will reload, and Copilot Chat will begin working as expected again.

Sunday, November 12, 2023

Blazor WebAssembly Lazy Loading Changes from .NET 7 to .NET 8

Lazy Loading is an essential tool used in web client development to defer loading of resources until requested by the user, as opposed to loading everything up-front which is expensive. Blazor has had the ability to lazy load Razor Class Libraries for the last several versions of .NET, but there are some updates in .NET 8 that aren't well documented.

To not be completely repetitive, here are the basic steps for implementing lazy loading in your Blazor WebAssembly application direct from the Microsoft docs: Lazy load assemblies in ASP.NET Core Blazor WebAssembly

The issue is the Project Configuration and Router Configuration sections of the docs as of this post are still not up to date. With .NET 8, the WASM assemblies are now built as .wasm files not .dll files and therefore the main update you'll need to make are inside the .csproj file and within the definition of the LazyAssemblyLoader routing code to use the .wasm file extension for the referenced .dlls:

.csproj file updates


Routing file updates


If continuing to use the old code with the .dll extension you would get the following error on building your application:
Unable to find 'EngineAnalyticsWebApp.TestLazy.dll' to be lazy loaded later. Confirm that project or package references are included and the reference is used in the project" error on build
Upon making the required updates to your .NET 8 application to prevent the error above, your app should successfully build, and you'll see the correct deferred execution in the browser.


Friday, November 3, 2023

Dealing with Time Skew and SAS Azure Blob Token Generation: 403 Failed to Authenticate Error

If you're working with the Azure.Storage.Blobs SDK in .NET and generating SAS tokens, you might come across an error like the following when making a call to GetUserDelegationKeyAsync():
Status 403: The request is not authorized to perform this operation using this permission

Here is a sample of code that might throw this error in which the startsOn value is set to the current time:

Before you start double checking all of the user permissions in Azure and going through all the Access Control and Role Assignments in Blob Storage (assuming you do have them configured correctly), this might be a red herring for a different issue with the startsOn value for the call to GetUserDelegationKeyAsync(). The problem is likely with clock skew and differences in times from the server and client.

It is documented in SAS best practices from the Azure docs (found here), the following issue with clock skew and how to remedy the issue:

Be careful with SAS start time. If you set the start time for a SAS to the current time, failures might occur intermittently for the first few minutes. This is due to different machines having slightly different current times (known as clock skew). In general, set the start time to be at least 15 minutes in the past. Or, don't set it at all, which will make it valid immediately in all cases. The same generally applies to expiry time as well--remember that you may observe up to 15 minutes of clock skew in either direction on any request. For clients using a REST version prior to 2012-02-12, the maximum duration for a SAS that does not reference a stored access policy is 1 hour. Any policies that specify a longer term than 1 hour will fail.

There is a simple fix for this as instructed to modify the startsOn value to be either not set or 15 minutes (or greater) in the past. With this updated code, the 403 error is fixed and will proceed as expected.

Wednesday, October 18, 2023

Fixing PowerShell Scripting Error in C# Code: "Exception calling ""ToString"" with ""0"" argument(s). There is no Runspace available to run scripts in this thread."

A bit of a niche post here, but maybe someone is searching the interwebs and this will help save some time. When running a PowerShell script in C# leveraging the System.Management.Automation library, you might run into some neuanced issues that behave differently than when running PowerShell commands directly via the command line. Here is one instance, take the following PowerShell command to install a new Windows Service:
New-Service -Name "MyWindowsService" -BinaryPathName "C:\SomePath\1.0.1\MyWindowsService.exe"
When running this in a PowerShell terminal, it will generate the following output which as documented is an object representing the new service:
Status   Name               DisplayName
------   ----               -----------
Stopped  MyWindowsService   MyWindowsService
This is actually helpful output for a human, and maybe even for logging, bu when running this same command in C# via a PowerShell instance, the command will technically work, but you'll get the following cryptic error:
"The following exception occurred while retrieving the string: ""Exception calling ""ToString"" with ""0"" argument(s): ""There is no Runspace available to run scripts in this thread. You can provide one in the DefaultRunspace property of the System.Management.Automation.Runspaces.Runspace type. The script block you attempted to invoke was: $this.ServiceName""""", System.Object,System.ServiceProcess.ServiceController,System.WeakReference`1[System.Management.Automation.Runspaces.TypeTable], System.Management.Automation.PSObject+AdapterSet,None,System.Management.Automation.DotNetAdapter,"",System.Management.Automation.PSObject+AdapterSet, System.ServiceProcess.ServiceController,System.ServiceProcess.ServiceController,"PSStandardMembers {DefaultDisplayPropertySet}",False,False,False,False,False, "","",None
OK not very helpful. It took a while but I deduced the output from the New-Service cmdlet was causing this issue. There are 2 ways I found to handle this.
  1. Suppress the Output: Since this is running in C# without human intervention, pipe in the option to suppress the output if you are not logging it or using it for some meaningful purpose. Remember, you can still get the status by using Get-Service to inspect the newly installed service, as opposed to reading the output. Use the updated command to accomplish this:
    New-Service -Name "MyWindowsService" 
    -BinaryPathName "C:\SomePath\1.0.1\MyWindowsService.exe" | out-null
    
  2. Return the Output to a Variable: The other option is simply to return the output of the cmdlet typically for use to inspect. This could be done with the following updated statement:
    $newServiceResult = New-Service -Name "MyWindowsService" 
    -BinaryPathName "C:\SomePath\1.0.1\MyWindowsService.exe"
    
    Keep in mind he return value is of type System.ServiceProcess.ServiceController, so you can use that as needed.
For my needs I prefer option #1, as I don't need to inspect the return of New-Service and as mentioned can use Get-Service to further inspect any Windows Service status at this point. With either method though you will no longer get the cryptic error as previously shown.

Thursday, September 21, 2023

How to Disable Either Classic or YAML Pipelines in Azure DevOps (ADO)

If you have pipelines in Azure DevOps that you don't want to trigger automatically either because they are legacy and remain for reference, not currently being used, or just need to temporarily disable, there are different ways to accomplish this based on the type of pipeline.

Classic Pipelines

  1. Select the Classic Pipeline and press the 'Edit' button


  2. Select 'Triggers'


  3. Uncheck the box for 'Enable Continuous Integration'


  4. Save the Pipeline


YAML Pipelines

  1. Select the Classic Pipeline and press the 'Edit' button


  2. Select the ellipsis (3 dots) in the top-right hand corner, and select 'Settings'


  3. Select the 'Disabled' radio button, and press 'Save'


  4. The pipeline is confirmed disabled via the label next to the name


Wednesday, September 20, 2023

Leveraging IntelliSense for Azure DevOps YAML Pipelines in Visual Studio Code

If you're building out YAML pipelines for Azure DevOps (ADO) and don't wish to hand roll them in the online editor provided, you can instead build them in Visual Studio Code. The 1st thing you'll be hunting down though is IntelliSense and auto-complete assistance for your .yml pipeline code. Out-of-the-box, VSC doesn't have this support other than generic YAML language services so you'll want an extension. There is an extension for this and name of it is simply, 'Azure Pipelines' which can be found in the Marketplace. 


The issue is the Microsoft extension for the ADO pipelines is poorly rated at 2 out of 5 stars which made me wonder if it wasn't worth using. The good news is that rating isn't in reflection for a completely orphaned product as the latest commit was within a week of this writing. The main critique which I verified is after installation it just doesn't seem to do anything. However, with a single-step I got the primary functionality working as desired and have the IntelliSense and auto-complete features I needed.

The key is to manually switch the 'Language Mode' setting in the bottom-right hand corner to the proper value for the specific code file being created (or use the keyboard shortcut Ctrl + K M). Initially it will show 'YAML' which has been auto-detected, and in this mode none of the extension characteristics work. 


Click the dropdown and you'll get a selection of languages that can be set. Select, 'Azure Pipelines.'


Now the .yml file you're working on will have IntelliSense features, auto-complete, and hinting leveraging the installed extension which is helpful in creating pipelines.


Friday, July 28, 2023

Reading Environment Variables, AppSettings, LocalSettings, and User Secrets Seamlessly Across Environments in ASP.NET

One of the biggest challenges we face in modern cloud solutions is making it so sensitive configuration data can be read seamlessly across all environments from the local dev environment all the way to production. This isn't really a new issue, but one that has multiple ways to accomplish some easier than others.


For a sample use case, we might have a database connection string with sensitive information that needs to work seamlessly in code for local, Dev, QA, Stage, Prod, etc. without a lot of special hooks or handling in code. One way to handle this in the cloud regardless of deployment resource or setup is to expose a single key name with unique value per-environment. This can be configured via scripting in deployment pipelines per environment to take care of the DevOps side of this equation. However in code we want this single-read of a key to work in all environments. This is where in .NET the Configuration provider offered in Microsoft.Extensions.Configuration works so well.

Let's say the following environment variable has been configured across Dev, QA, Stage, and Prod environments with respective values already:
CosmosDbConnectionString | AccountEndpoint=https://cosmos-acct-{env}-eus-001.documents.azure.com:443/;AccountKey=abc123...
For local development we have a couple options as well to configure this value:
  1. Create your own environment variable on your local OS with the identical key name and whatever value you choose
  2. Add the identical key and again whatever value you require as a 'User Secret' within Visual Studio or VS Code (VS Code requires an extension download to work with secrets)
The above 2 methods are preferred as they do not add to files that get committed to source control. While you can add the key/value pairs to appSettings.json or launchSettings.json (as env variables), these are not advised as it breaks the requirement that we should not be committing secrets to source control. Note - you could also write a PowerShell script to be added to the solution that developers could run initially to pull environment variable key names from the cloud modifying with a local value for an added bonus to be even more automated.

So moving back to our .NET code, we would like to have a single line that uses 'CosmosDbConnectionString' that will work for all environments.

To get started, in current versions of ASP.NET, this single line of code in program.cs sets us up out of the box:


The absolutely fantastic feature of this black-box is that it will automagically handle the hierarchy of running through multiple different configuration sources including environmental variables! This single line of code (after injecting the IConfiguration configuration service) is all that's needed:


Here is the official documentation on this from Microsoft:
Using the default configuration, the EnvironmentVariablesConfigurationProvider loads configuration from environment variable key-value pairs after reading appsettings.json, appsettings.Environment.json, and Secret manager. Therefore, key values read from the environment override values read from appsettings.json, appsettings.Environment.json, and Secret manager.
This is great, because now we can add our connection string as a local secret (or local environment variable) and have it read at runtime during debugging as required, but once deployed the configured environment variables per-environment will supersede anything from appSettings, secrets, etc. and continue to work with the same code.


This is also the case for non-sensitive data stored in appSettings.json locally vs configuration in a deployed environment like Azure. Any configuration settings in Azure per-environment using the same key name will supersede locally configured values. This use case is more well-known but worth mentioning as it's an anti-pattern to have different environment configs managed at the source control level; it should be managed in deployed environments via DevOps.

A last point to review is naming conventions when creating environment variables so they work platform agnostic. Per the same MSFT docs linked above:
The : delimiter doesn't work with environment variable hierarchical keys on all platforms. For example, the : delimiter is not supported by Bash. The double underscore (__), which is supported on all platforms, automatically replaces any : delimiters in environment variables.
Therefore if you need a hierarchical key consider using the following naming structure which will work on Windows and Linux:
CosmosDb__ConnectionString
This can be read regardless of deployed environment in code with the following line:


Thanks to the .NET configuration provider having all of this included functionality, we can work across 1..n environments using a multitude of configuration options, yet being able to garner that data at runtime with a single line of code!

Thursday, June 8, 2023

How to Reorder the Profiles in the Windows Command Prompt / Terminal

The Windows Command Prompt / Terminal tool has gotten more robust over the years, and makes using a tool like ConEmu (that I used for years), less of a pressing need. That's because the tabbed profiles are available, and makes selecting new tabs for different profile types (Bash, PowerShell, Azure Cloud Shell) a breeze. However there isn't a configured setting option for reordering for those of us that like to organize this sort of thing (i.e. making the ones I use the most at the top of the list). There is a feature enhancement on GitHub (Profile reordering for Settings UI), but for now there's a trivial way to go ahead and modify it today. Here's a picture of the profiles I have setup currently:
I want to reorder these, and the easiest way to do this is to open the 'Settings' from the dropdown of profiles above and select, 'Open JSON File' from the bottom left-hand corner of the dialog:
Now it's simply an act of rearranging the index in the array collection within the settings file. The index location in the array will dicate the order of the profiles in the command prompt window:
Once the changes are complete, save the file, restart the command prompt, and you'll see the new order of the profiles!

Monday, February 13, 2023

The State of JavaScript and Modern Web Client Development

Here is a link to a white paper I wrote named, 'The State of JavaScript and Modern Web Client Development.' If you need help navigating the waters at a high-level in the modern web landscape, make sure to check out the article.

Monday, November 7, 2022

Overloaded Methods in TypeScript

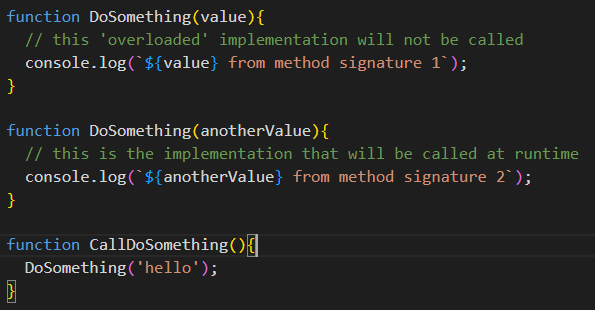
If you've ever worked with a language like C# or Java you're probably often using overloaded method signatures to provide callers with an opportunity to have a similar outcome by passing a different number or type of parameters. However in TypeScript which is just a superset of JavaScript and adhering to all things JS under the covers, method overloading doesn't work the same with identical method names and parameter signature because there are no types to differentiate between. If you have (2) identical methods in JS being called the latter defined method on the prototype will be called, and the former ignored.


TypeScript has the benefit of type definitions at build time so method overloading is possible... kind of. If the goal is to have intellisense to see multiple definitions of the same overloaded method, we can certainly achieve that. If the goal is to have multiple definitions of the same method name with different parameter signatures and separate, different implementations, this out of the box is not possible and won't be like traditionally static typed, structured languages like C#. Regardless let's see how overloading does work in the vanilla form (I'll hint at conditional types at the end) using TypeScript and you can decide if you can leverage for your benefit.

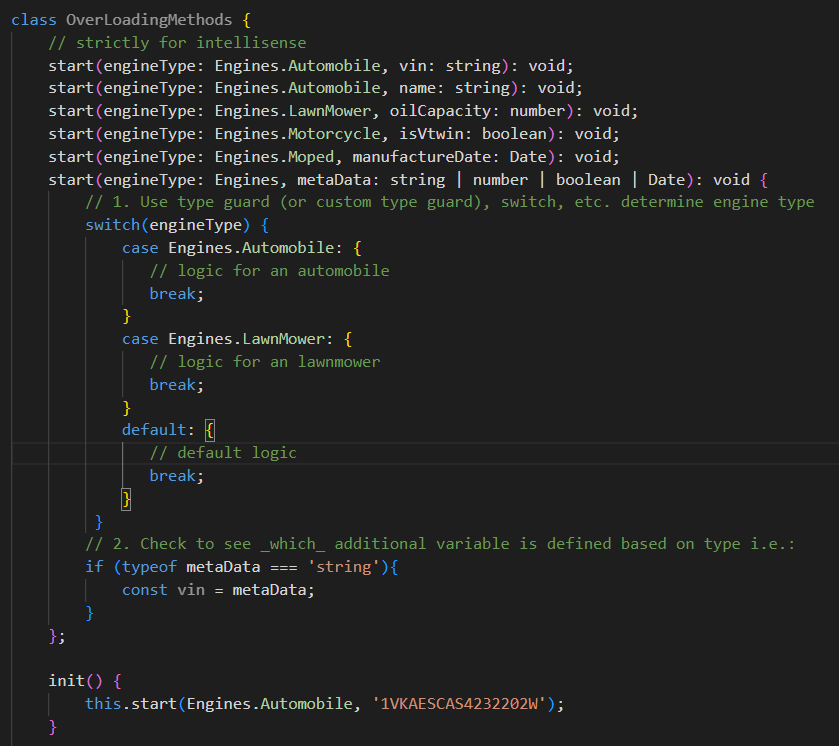
The recipe for overloaded methods in TypeScript is that you can create 1...n method signatures, but only have a single implemented method representing any of the possible call combinations. Let's look at a code sample:

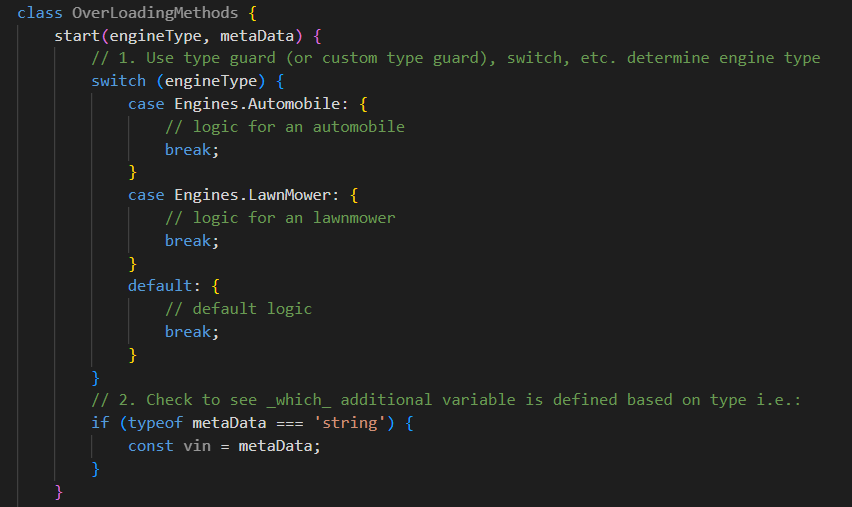
Above we have the overloaded method named start, that represents the potential to provide the different procedures to start an engine, based on the various engine types. Note the (5) overloaded method signatures, but only a single implemented method. The reason for this is the overloaded behavior and differentiation of methods is a design/build time only feature available due to the fact we are using TypeScript. In fact if you look at the transpiled JavaScript the only method shown is the single implemented method:

If you do try and use implementations on more than 1 method with the same name, TypeScript will warn you with a, "Duplicate function implementation" warning.

Looping back to our original goal using the properly implemented code, as the method caller if we want to see at design time a list of the various signatures, we have indeed accomplished that goal as you may scroll through and see the multiple, overloaded definitions:

However this comes at a bit of a sloppy cost for that single implemented method. In order to make this work the method signature must encapsulate all potential values that could be sent to satisfy the TypeScript compiler. This usually equates to using a Union type in the method signature to account for all possible types. The next hurdle is because overloaded methods are really a façade, you must manually pick apart what's sent and reverse engineer what you received at runtime. This usually equates to type guards, if statement, switch statements, or some combination to sniff out what you received, so you can proceed forward. All of this logic is that code above within our implemented method to determine what exactly we received.

It's even trickier to determine what's sent if you have (2) identical method signatures that are only differentiated by variable name like our 1st two methods below. This is not advisable even though it does work:

The long and the short of method overloading in TypeScript is that it is possible, but with a few caveats that may not make it sensible. I think if you only have (2) different method signatures, that are easily discernable at runtime in the implemented code, then this might make sense. However as the signature list expands, the logic to differentiate the potential values sent can get unwieldly. 

Lastly another potential option may be to use conditional types in the method signatures which rely on generics to sort out the types based on what the caller is sending. This could reduce the need for the implemented method to contain all the logic to sort out which values it was sent as it will be know already. However in this post I wanted to strictly do a 1:1 look at the concept of overloading as it may be known from other languages, and how it can be accomplished in TypeScript.